Vayana Corporate Cockpit
Giving a corporate's finance team a single console to run an entire supply-chain-finance program - every dealer, every invoice, every rupee, without calling the bank.
- Role
- UI/UX Designer (end-to-end)
- Client
- Vayana
- Type
- Product · B2B FinTech
- Platform
- Web dashboard (desktop-first)
TL;DR
Vayana runs supply-chain finance: a large corporate (the "anchor") puts its network of dealers in front of multiple banks - HDFC, SBI, Bank of Baroda, Axis, HSBC and others - who fund the dealers' invoices against the anchor's credit strength. Money moves constantly, across dozens of dealers and several banks at once, and the anchor's finance team had no single place to see the health of that program. Answering "how much limit is used up?", "which invoices got rejected and why?", "who's overdue?" meant emails, spreadsheets and phone calls. The design problem wasn't "make a dashboard" - it was turning a live, multi-party financial operation into a console a non-analyst finance manager can actually pilot: read the program's state at a glance, drill from a headline number down to the single overdue invoice, pull the exact report an auditor asked for, and delegate all of it safely across a team.
The core challenges
- 01Density without overwhelm - a live SCF program is a firehose; it has to be scannable and drillable at once.
- 02Every number must be traceable - a KPI that can't drill to its underlying rows is untrustworthy in finance.
- 03Multi-bank, multi-dealer reality - the same dealer appears across banks with different limits, statuses and expiry dates.
- 04Self-serve reporting - finance is asked for bespoke cuts constantly and shouldn't have to file a data request.
- 05Designing for the un-pretty states - overdues, declined loans, exhausted limits must be first-class, not error banners.
- 06Safe delegation - access control granular enough to match real finance roles, without making setup an ordeal.
Design solutions
A KPI-led dashboard that answers "is my program healthy?" in one glance
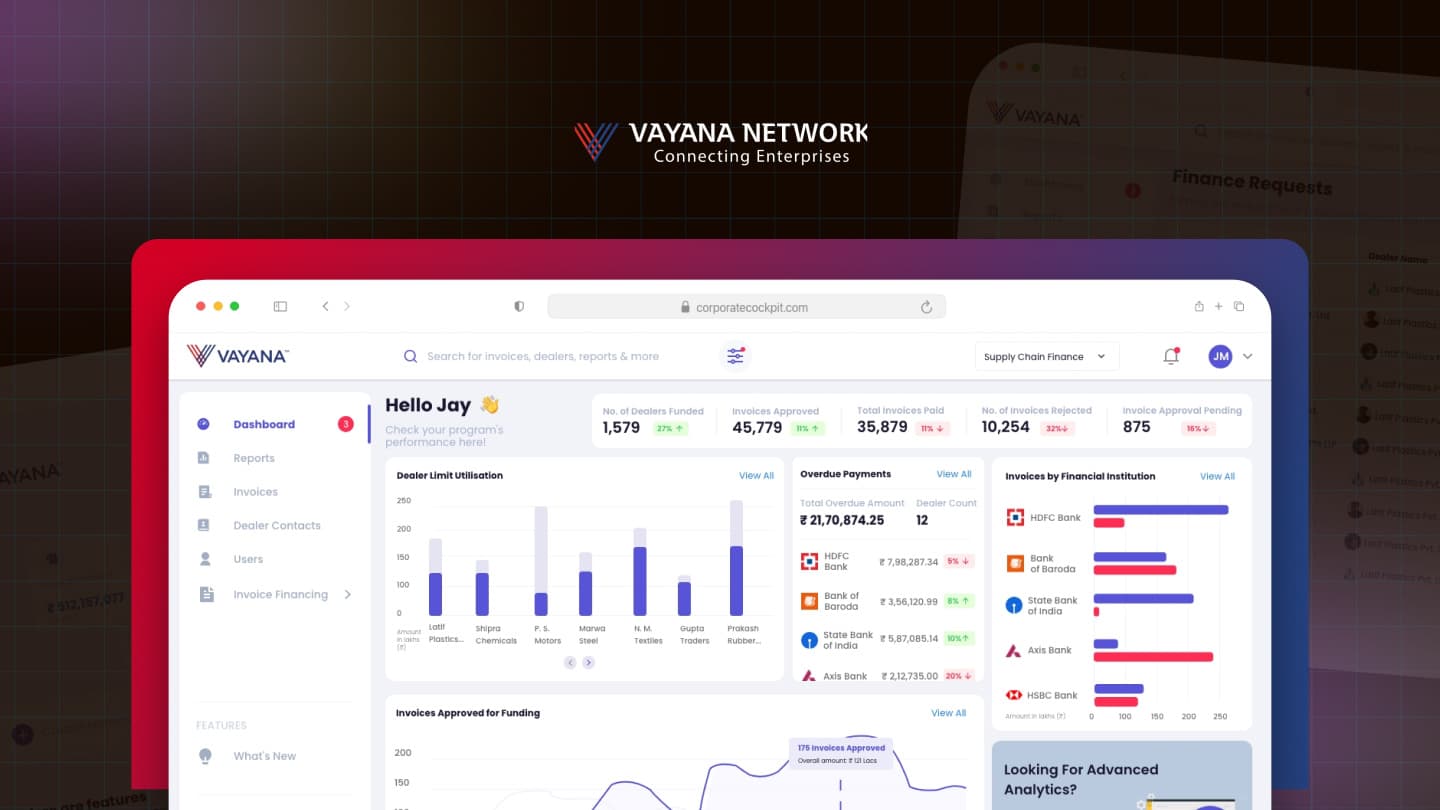
The landing dashboard opens with a six-metric strip - Dealers Funded, Invoices Approved, Total Invoices Paid, Invoices Rejected, Approval Pending - each paired with a directional trend chip (27% ↑, 32% ↓, colour-coded) so the user reads not just the number but its movement.
Below it, the program's shape is told through a deliberately small set of visualisations: Dealer Limit Utilisation, Overdue Payments ranked by bank, Invoices by Financial Institution, and Invoices Approved for Funding over time. The whole first screen is engineered so a finance manager knows within seconds whether today is a normal day or an act-now day.
Every card drills - headline to rows to detail
The dashboard is not a dead end. Every module carries a "View All" that opens the full operational table behind the summary, and those tables open detail drawers.
The path from "₹21.7L overdue across 12 dealers" on a card → the ranked overdue table → a single dealer's overdue invoices with overdue-since counters is one continuous, trustworthy drill. This is the core interaction principle of the whole product: no number is a dead number.
A self-serve report builder - the finance team's escape hatch
The centrepiece of the self-serve promise. Create New Custom Report lets a user name a report, set a period, pick fields via a dual-list "Available → Selected" transfer, add rich elements (Analysis, Single KPI, Sparkline) through a multi-step widget wizard, then schedule delivery: download or email to a named recipient, choose CSV, zip it, and save the template for reuse.
The intent: a finance manager should satisfy an auditor's ad-hoc request - the right fields, the right window, delivered on a schedule - without ever filing a data request.
Operational tables built for the un-pretty states
The workhorse of the cockpit is a consistent, filterable data-table pattern, designed hardest for the states that drive action: Limit Utilisation (Total / Utilised / Available per dealer per bank, with an explicit Available/Unavailable status dot and expiry date), Overdue Payments, and Declined Loans.
The important one: a rejection isn't just a status - it carries the bank's own comments in a side drawer, timestamped, so the corporate sees why a loan was declined and can act, instead of hitting a silent "Rejected." That comment thread is the seam where the bank's decision becomes something the corporate can respond to.
Every table shares the same anatomy - bulk-select, dealer avatar, bank logo, right-aligned currency, status pills, pagination, filters - so the pattern is learned once and reused across the product.
Finance requests and trade documents - the live funding pipeline
Beyond monitoring, the cockpit tracks work in flight. Finance Requests shows each request's Requested / Funded / Settled amounts and dates, tenor and live status, with a detail drawer that stitches the full picture together - anchor, dealer, dates, amounts, and the linked trade documents.
Trade Documents provides a structured multi-row upload (Buyer → Dealer → Invoice scoping, per-row file type / description / document / remarks) so the paperwork underpinning each funding is attached to the right request rather than living in email.
Granular, preset-driven role-based access - safe delegation
Handing a live financial console to a team required real RBAC, usable by a non-technical Admin. Create User is a two-step flow; step two is a permission matrix - per module, per capability, with independent View / Edit / Download checkboxes down to sub-actions like Apply Filters and Export Data.
To keep that power from becoming tedious, the panel offers role presets (Manager / Associate / Admin) as one-click starting points and a "Save as Preset" so a corporation can codify its own roles once. The Export/Download column in particular matters when the data is this sensitive.
Reflection
- The drill is the product, not the chart. The most valuable design work is the unglamorous continuity from a KPI to the exact rows and the export behind it - I'd treat traceability of every number as an explicit, testable requirement from day one.
- The seams carry the trust. Rendering the banks' decisions honestly - a rejection with its comment, a limit marked Unavailable, an overdue-since counter - is what makes a corporate believe the cockpit reflects reality.
- RBAC deserved more upfront thought than a settings screen usually gets. In a multi-user financial console, the permission matrix is a core feature, not an afterthought.
- The report builder is the highest-leverage bet - and the one I'd most want to measure. If finance can self-serve an auditor's request, that's a whole category of manual work removed.
Visuals are recreated / sanitised representations for portfolio use and contain no real client data. Scoped to the corporate cockpit surface; the dealer-side origination/onboarding flows are covered separately.